Workers Compensation Data Shows Same Old Story
PropertyCasualty360
August 20, 2012
The 2012 edition of the National Council on Compensation Insurance’s (NCCI) annual State of the Line report, evaluating Workers’ Compensation fundamentals and conditions, reveals a market characterized by a number of countervailing indicators as to its forward trajectory.
In some ways, we are seeing improved conditions in the Workers’ Comp space over previous years; by other measures, the market remains in a worrisome state.
PARSING THE NUMBERS
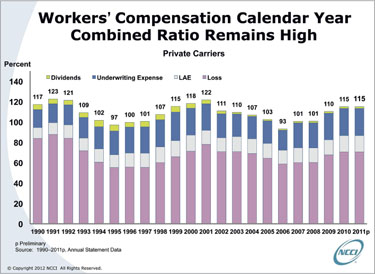
For the third straight year, Workers’ Comp holds the dubious distinction of having the highest combined ratio of all of the major commercial lines: 115 in 2011, the same number as in 2010.
It is important to remember that the 2010 number was influenced by the fact that one carrier had significantly strengthened its excess Workers’ Comp reserves, adding three points to the combined ratio for 2010.
Without that strengthening, the combined ratio would have been 112. Since there appeared to be no excess Workers’ Comp reserve-strengthening in 2011, that 115 combined ratio may actually be viewed as a further deterioration.
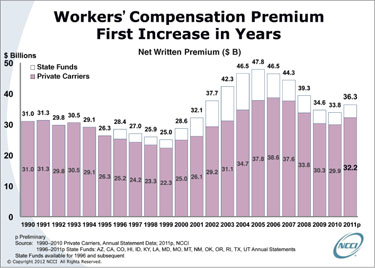
Because of its direct connection to employment and the labor markets, Workers’ Comp has been the P&C sector most significantly impacted by the Great Recession. As a whole, the line (including state funds) experienced a drop of more than 25 percent in premium between 2006 and 2010, coupled with more than a 20-point increase in combined ratio over the same time period.
However, in 2011 net written premium increased by 7.4 percent to $36.3 billion. This boost is the first since 2005, and it is a welcome shift following the cumulative 27-percent decline in premium between 2006 and 2010.
But most of that increase was actually due to the rebound in premium audit impacts that so depressed 2010’s premiums: Almost none of the increase was due to price, either through bureau-filing activity or changes in carrier discounting.
ACCIDENT-YEAR RESULTS
Analyzing experience on an accident-year basis can provide additional insights into the underlying performance of long-tail lines like Workers’ Comp, without the distortions of prior-year reserve adjustments.
NCCI estimates the combined ratio for private carriers for accident-year 2011 is 114—down two points from 116 in 2010. This improvement is likely due to understated calendar-year 2010 premium.
On an accident-year basis, the current underwriting cycle turned in 2006 when the combined ratio was 86. Since then, the combined ratio has increased by almost 30 points.
RESERVE POSITION BEGS CLOSER ATTENTION
The private-carrier reserve position continued its modest deterioration in 2011 for the fourth consecutive year. Notably, NCCI’s estimate of the reserve position for the private carriers as of year-end 2011 shows an $11 billion deficiency.
After allowing for the permissible discounting of the indemnity reserves for lifetime pension cases, that inadequacy is about $5.9 billion, which is about 5 percent of the carried reserves of more than $113.3 billion. Although most of the deficiency is associated with accident years prior to 2002, NCCI’s estimate includes some deficiency in the current accident year.
The industry needs to keep a close watch on reserve adequacy: It can deteriorate very quickly if reserves for the most recent accident year are initially deficient.
BUREAU RATE/LOSS-COST CHANGES
Average bureau-filed rate and loss-cost changes also saw an unfavorable reversal in 2011.
For most of the previous decade, overall bureau loss costs were declining, with ongoing declines in claim frequency offsetting increases in claim severity. Since 2006, NCCI loss costs generally declined, with the declines gradually moderating from -5.3 percent in 2009 to -1.2 percent in 2011.
In contrast, so far in 2012 loss costs have generally increased, with NCCI loss costs up 2.5 percent on average and countrywide bureau loss costs up 7.8 percent. The countrywide increase in 2012 is mostly due to a large increase in bureau loss costs in California. The increases in NCCI states have been attributable to a number of factors, including longer claim durations.
CLAIM FREQUENCY DOWN
Workers’ Comp lost-time claim frequency improved in 2011. After increasing 3 percent in 2010, claim frequency in 2011 declined 1 percent on average in NCCI states.
As we surmised in 2011, many of the new claims coming into the system—and causing the somewhat higher levels of frequency in the last couple of years—appear to be small lost-time claims.
INDEMNITY, MEDICAL AVERAGE CLAIM COSTS SEE MODEST INCREASE
NCCI research last year suggested that some of the increase in average medical claim costs may have been driven by an influx of small claims, both small lost-time and medical-only claims.
This supposition was verified by additional NCCI research showing that from 2009 to 2010, medical-only claim frequency increased 3 percent, while all lost-time claim frequency increased 4 percent and small lost-time claim frequency (that is, claims less than $2,000) increased by 6 percent.
This increased frequency of small claims is a reversal of the significant drop in the frequency of small claims from 2007 to 2009. Over that two-year period, lost-time claim frequency dropped 8 percent, while small lost-time and medical-only claim frequencies dropped 11 percent and 12 percent, respectively.
We believe that these frequency changes by size of claim were driven by the depth of the last recession, which produced significant changes in claim behavior. As the recession deepened in 2008 and 2009, small-claim frequency dropped more rapidly than larger-claim frequency. As the modest recovery started, the frequency of smaller claims increased as the workforce stabilized and grew a bit in 2010 and 2011.
This shift in the mix of claims also affected claim severity: In 2010, the average indemnity cost per lost-time claim decreased by 2.8 percent. In 2011, the average change was a very modest increase of 2 percent. The average change in medical cost per lost-time claim showed similarly favorable results. In 2010, the average cost per claim was up just 1.3 percent, while in 2011, the increase was 4 percent. These are the lowest increases in average claim costs since the early 1990s.
In spite of this shift, the underlying cost-drivers for both indemnity and particularly medical are still present. This means that medical costs, absent the claim shifts, are still likely to be increasing in excess of medical CPI—as they have done for many years.
RESIDUAL MARKET GROWING
Depopulation of the residual market ceased in 2011, reversing the trend of declining residual-market premiums that began in 2005. Premiums grew by 7 percent in 2011 to approximately $500 million. Overall, the market share of the residual-market pools serviced by NCCI for 2011 increased from 4.6 percent to 5 percent.
The combined ratio of the residual-market pools also increased slightly, from 120 in 2010 to 121 in 2011. At this time, the pools are quite small, so individual losses and states can have a disproportionate impact on the combined ratio. In 1998–2000, when the pools were of similar size in the last cycle, the combined ratio also climbed to nearly 120.
Residual-market growth in 2011 was fueled by large policies entering the market. Premium for policies greater than $100,000 increased by nearly 50 percent from 2010 to 2011; premium for policies between $10,000 and $100,000 grew by more than 15 percent during the same period. That rapid growth continued in the first quarter of 2012, with premiums increasing for all policy sizes over the first quarter of 2011 (with the largest increases occurring in the largest policy sizes).
LOOKING FORWARD
The total P&C insurance industry had its challenges in 2011, and Workers’ Comp was no different. Combined ratios remain at unsustainably high levels, and investment returns are not sufficiently high to generate operating returns near the cost of capital.
Although claims frequency declined in the latest year, it is unclear whether it is yet returning to its long-term downward trend. The small change in average severity of lost-time claims is at least partly attributable to an increase in the number of smaller lost-time claims reported in the last couple of years, and it does not necessarily reflect an underlying reduction in medical and indemnity cost drivers. In addition, reserve adequacy continues to slip.
On the more positive side, the growth in written premium provides support that the worst of the recession has passed. Additionally, the industry is well capitalized for the future.
Overall, NCCI continues to monitor the following areas of concern:
- Claim frequency
- The underwriting cycle
- Uncertain impacts from health-care and financial-services reforms, including the Federal Insurance Office
- Efforts to expand alternatives to Workers’ Comp
Like every other American business, we continue to await a real and sustained economic recovery that will put people back to work and help revive the Workers’ Comp industry. Until that happens, we see continued slow growth and a market whose future remains uncertain.
It all adds up to what's going on today. As insurance companies are making no profits, they will not continue to write premiums with negative returns. We see them starting to be more selective, analyzing new submissions' losses, and in many cases non-renewing premiums. As we see for the first time ever, more and more $100,000+ premiums are being forced into the residual marketplace with 50% increases in premiums. The formula is simple: insurance companies make no money writing workers comp, they're getting no investment income, one day they wake up and say "hey, why do we bother coming to work every day?" Like the rest of us, they go to work to make money. So they hold a meeting on profitability and they decide that they're going to tighten the belt. Now, if you're a producer who has had fairly good relationships binding workers comp premiums directly with carriers you are now scrambling because they carriers are rejecting many of your accounts. Let us help you. With workers compensation premium recovery for your clients, we'll be able to give your clients refunds on prior years, reductions on current year, and a better underwriting profile to enter the new marketplace with. Certainly this service can help with no charge for you or your clients or prospects. Our program offers you commissions and partnering up with Apex will only make you as the broker look great to clients and prospects.
